Monday, March 9, 2015

First Law of Thermodynamics

The review for the quiz for the beginning of the class on evaluating the graph and finding the mass of the water.


Prof Mason submerging the flask into ice water and warm water.  The syringe acts like a piston and displace a change in volume inside the syringe.


Our prediction of the work being done by the system shown that the syringe will move  upwards (increasing in volume).


The first law of thermodynamic on the left side, and the interpretation of the first law in the words for a 7 yr old to understand.

Examples of isothermal process:   a balloon losing air and the change of volume is the work done on the system.


A sample calculation from the lecture to find the change of volume using work = (delta)V*p and the conversion of units. 


The derivation of a function in terms of mass and velocity.


Using a cube, we find the function of pressure in terms of volume.


Using relation of pressure we find in the above picture, we find the function of temperature in terms of kinetic energy.


We further examined the isothermal process by evaluating the inernal energy, and the adiabatic process from work done.


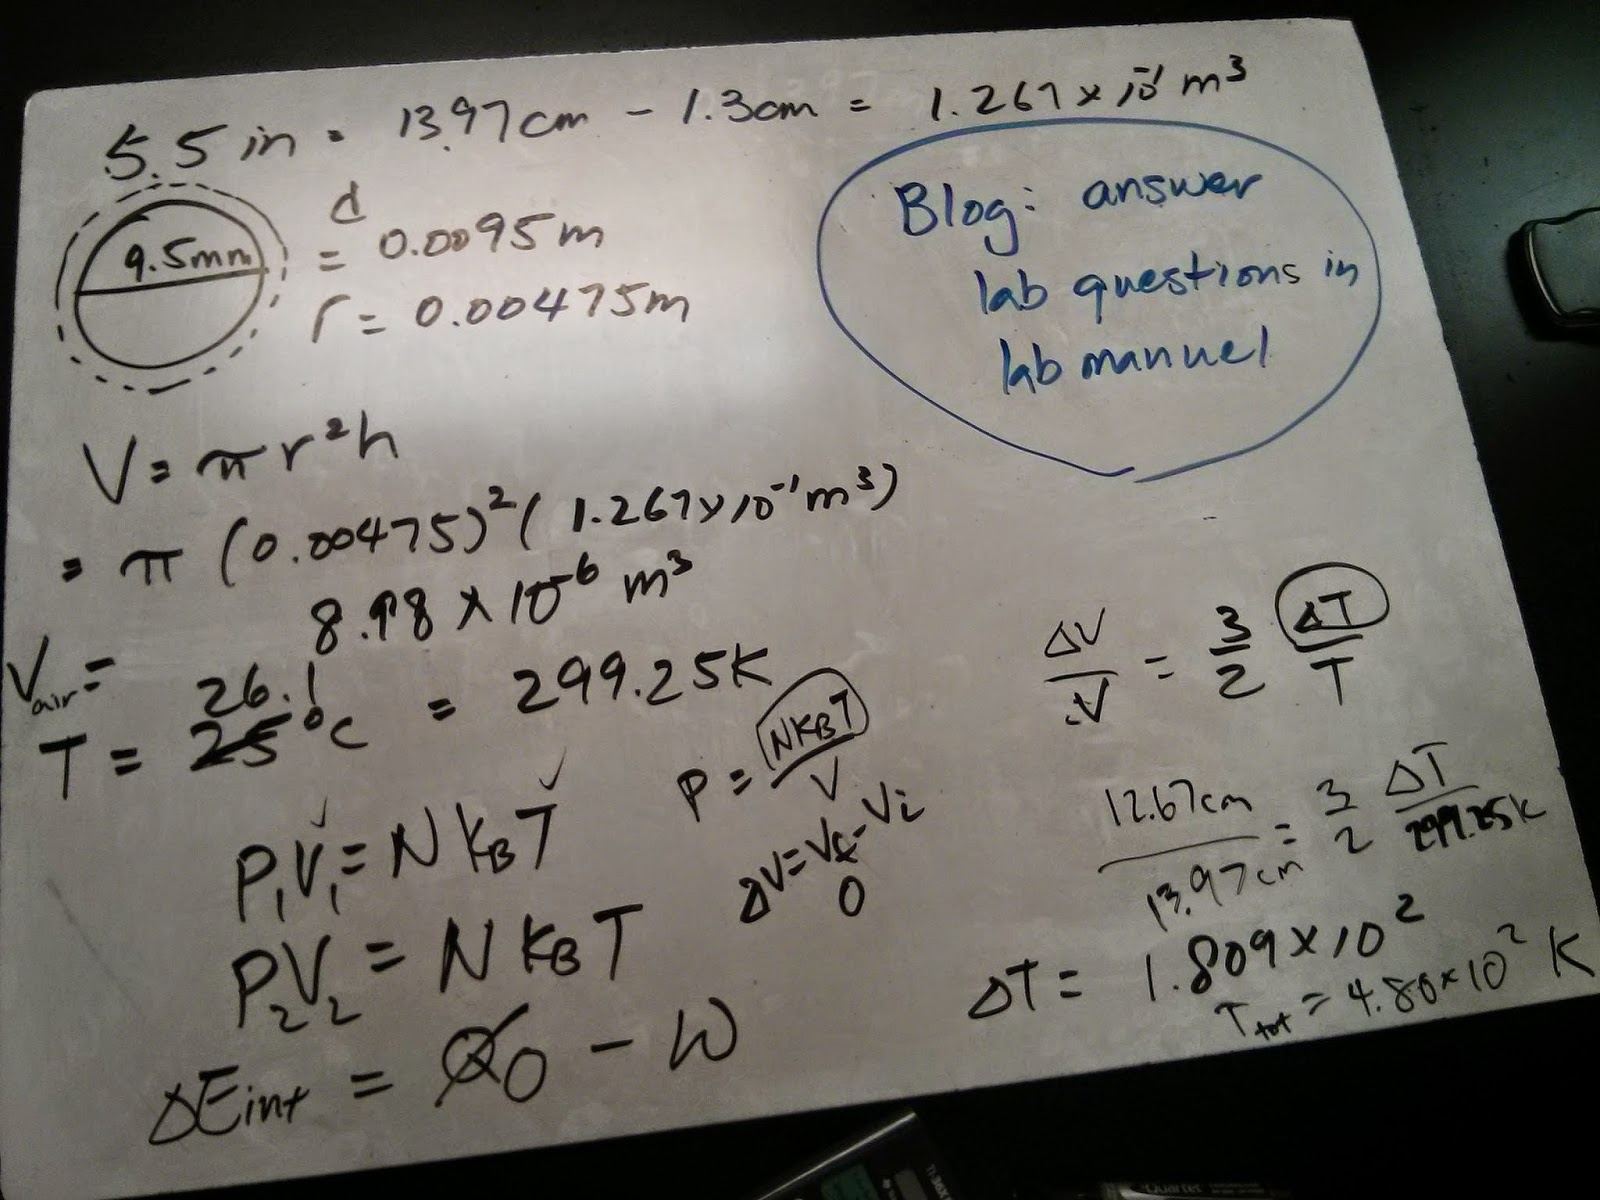
The calculation of the change of temperature inside the fire syringe.  The change of volume from the work done on the system causes the temperature to go up high rapidly due to the inverse relationship of volume and pressure. 


Homework:


Wednesday, March 4, 2015

Thermal Properties of Matter cont.

The prediction of the hot aluminum can rapidly implode when submerged into ice water sealing off the opening.  The can immediately shrunk the volume.


The aluminum can took in the volume of the water as the temperature drops, instead of shrinking the volume of itself.


The seven units of pressure and the conversion of atm to Pa.


Prediction graph of the relationship of pressure versus volume.  The graph predicts an inverse relationship decaying as volume increases.


The actual experiment using lab instruments and the line fit using y=1/ax+b.  The fit of the curve is inverse with the adjustment of b shifting the graph to where the data line is.


The prediction of the pressure versus temperature graph.

The data for initial pressure and temperature before the start of the experimentation.


Data from the experiment showing a linear relationship instead of the curved relationship as predicted in the previous photo.


The further examination of the Boltzmann's constant, the R constant, and Avogadro's constant.


Sample calculation from the lecture notes


The increase of volume when pressure of the air was vacuumed away.  The balloon was dramatically increasing in size.


Prof Mason released the pressure and the balloon goes back in it's original volume.


Our prediction of the balloon and marshmellow in the vacuum pressure chamber.


Sample calculation from the lecture notes.